 Service Assurance & Fulfillment
Suite of proactive event, applicaiton & servide performance monitoring and traffic flow analysis
For service providers to differentiate themselves they must meet their customers' needs quickly, efficiently and accurately. Providers lose millions of dollars annually because of poor processes during the provisioning process, and partially integrated business and operation support systems force operators into manual and tedious processes such as manual CLI, validation, and data entry. Manual and tedious processes result in slow, error prone provisioning that ultimately reduce efficiencies, upset customers, and impact cost.
The Redcell Assurance & Fulfillment Solution lets service providers shorten fulfillment processses and eliminate costly errors caused by manual processes, by deploying a proven solution that is customizable, robust and automated. Service providers can configure and provision orders faster and error free. Once services are deployed, it is critical that service providers provide the highest quality of service to their customers. To accomplish this task, service providers need a powerful suite of tools to effectively manage their network and the services that are deployed on their network.
Integrated Cross-Stack Solution
Redcell is the most versatile and fully-featured Customizable Off-the-Shelf solution available on the market for integrated multi-vendor flow-through provisioning and service assurance.
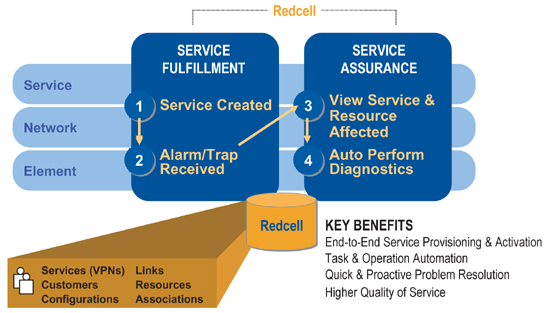
Redcell's Assurance Solution delivers powerful and flexible tools for service providers to monitor the health of their network and services to ensure the best customer experience.
As all Redcell products are integrated, Redcell offers a true end-to-end fulfillment and service assurance solution.
- Broadscope Event Monitor
- Active Performance Monitor
- Broadscope PM Analysis
- Broadscope Traffic Flow Analyzer
Redcell Broadscope Event Monitor:
Advanced event & fault monitoring that delivers insight into the health of IT assets.
- Identify real device/interface issues faster by filtering out event "white noise"
- Improve root cause analysis and time to repair when problems do occur
- Easily customize the system to take action on alarms appropriately
Key Features
- Real-time and historical views
- Event and alarm correlations for appropriate filtering and escalation
- Comprehensive notification capabilities (email, paging, etc.)
- Alarm import/export/forwarding
- SNMPv1, v2, v3 trap and Inform monitoring
- Syslog monitoring and filtering
- Flexible reporting on all events & alarms
Benefits
- Identify real device/interface issues faster by filtering out event "white noise"
- Improve root cause analysis and time to repair when problems do occur
- Easily customize the system to take action on alarms appropriately
Technical Specifications
| Event Monitor Technical Specifications | |
|---|---|
| Multi-Vendor Support (Examples) |
|
| Multi-Technology Support |
|
| Operating Environments for installation |
|
| Database | Embedded database or Oracle 9i, 10G, 10GRAC |
| Interface/Communication Protocols | SNMP v1/2/3; CLI: Telnet/SSH; RMI; XML; TCP/IP; HTTP; UDP Multicast |
Redcell Broadscope: Active Performance Monitoring
Proactive Monitoring of IT Services Health
Redcell Broadscope Active Performance Monitor (APM) lets you proactively monitor your complete IT service health, including proactively monitoring & detecting the health of devices, networks and services. With Redcell Broadscope APM, you can regularly poll critical health characteristics from multiple sources to immediately identify problems with IT devices, networks & services. It also lets you test and identify transactional problems with application & network services.
Active Performance Monitoring Features
- Isolate key health attributes & characteristics for IT devices, networks and application/network services
- Pre-defined Performance Monitors for key
- network device attributes-bandwidth utilization, port utilization, packet loss, etc.
- network services - aggregated network health, service health, DNS, DHCP, AAA, FTP, etc.
- application services - MS Exchange, MS IIS, DB connectivity, etc.
Create custom Monitors for specialized monitoring
Redcell Broadscope: PM Analysis
Wireless Network Performance Management
Broadscope provides automated end-to-end network management of today's 2G, 3G and 4G/LTE networks. One of the key applications in end-to-end network management is network performance management (PM). Broadscope plays a fundamental role in ensuring optimum performance in a highly dynamic mobile environment. Broadscope provides operators with both a near-real-time view, as well as a historical analysis, to all wireless network performance metrics in a web-based user interface.
Broadscope supports legacy 2G and 3G networks using sophisticated data collectors and storage mechanisms to collect performance data from network element operational measurement reports and call detail record (CDR). It provides a complete view of both the network's perspective of performance and the user's experience. All traditional traffic measurement and analysis capabilities are supported in Broadscope including Erlang and mathematic operators necessary to compile reports. It gives network operators complete control over what reports are needed and how they are viewed. Broadscope also provides powerful performance management capabilities for 4G/LTE networks and the IP environment utilized to connect them with the core application servers and the internet.
Broadscope provides the foundation functionality for self-optimization (SON) capabilities in both the non-standards based legacy environment and also in the standards based (3GPP) SON environment.
Redcell Traffic Flow Analyzer:
Complete Visibility Into IP Traffic Behavior
Redcell Traffic Flow Analyzer provides complete visibility into IP traffic behavior, usage patterns and network utilization to help identify those users, applications, protocols and conversations that are consuming most of the network bandwidth. This unified solution leverages IP flow analysis to enhance the availability and performance monitoring functionality of Redcell.
When unauthorized or low priority applications hog the network, managers typically respond by increasing bandwidth capacity. Throwing more bandwidth at the problem doesn't always solve the issue, or prevent it from recurring. Unauthorized applications only absorb any additional bandwidth while business critical applications suffer from poor response times. This always results in unpredictable bandwidth availability and network instability that compromises application performance. One approach is to set rate limits to control bandwidth usage by certain traffic, but this lacks the necessary visibility to distinguish between application types and it adds significant administrative effort and processing overhead to the network infrastructure.
Redcell Traffic Flow Analyzer collects and deciphers existing IP traffic flows to determine which applications and/or users are most impacting network and application response times and service levels. It offers better administrative control of unauthorized traffic and protection of valuable bandwidth for critical and demanding business applications.
Redcell Traffic Flow Analyzer also provides comprehensive visibility and reporting of network utilization though deep insight of top usage patterns. It lets administrators pinpoint what applications are consuming the most network bandwidth, what conversations are involved and who are the most active users.
Benefits
Increased Network Utilization and Performance
- Comprehensive visibility into how users, applications and protocols consume valuable bandwidth. Presents information in easy-to-understand graphs and reports.
Make Better Infrastructure Investment Decisions
- Tighten control of network bandwidth and security to provide better QoS for business critical applications and avoid unnecessary expensive upgrades. Accurately analyze the impact of network performance and bandwidth on service deployments.
Resolve Problems Faster
- Integration of IP traffic flow analysis into the Redcell unified management solution allows for quick problem resolution without the use of multiple point tools. Quickly understand traffic-related problems in the network and assist administrators to be proactive in taking automated or manual actions to remediate issues. Pinpoint degraded network resources to prioritize and remediate problems quickly.
Increase Operational Efficiencies
- Reduce Mean Time to Repair (MTTR) by leverage the existing infrastructure to expand the breadth, depth and coverage of the overall Redcell management system. Frees valuable resources to work on strategic tasks.
Reduce SW Expenses for Point Management Solutions
- Redcell's single-console management solution reduces the need for a separate IP Flow analysis tool. Reduces SW licenses, staffing and training expenses.
Features
Exporter Configuration
- Deployment of flow collector.
- Enable (or disable) collector.
- Register (or un-register) managed device to accept flow data from.
Drilldown
- Support for drilling down on a report line item to view detailed data.
- Available for: Exporter, Application, Conversation, Endpoint, Protocol, Sender and Receiver.
- Drilldown further at each level for applicable top N report selections.
- Drill down makes it easy to locate the data of interest.
- Report header contains tracking information to provide context to allow 'rewind' back to a previous drilldown step to start another path.
Conversation Details
- Directional data flow between endpoints in a conversation can be used to determine the primary source of traffic.
- Summary of traffic in a conversation is presented containing:
- Time of occurrence
- Amount of data
- Source endpoint
- Destination endpoint
Customization of Views
- Chart display options: Bar, Line, Pie charts
- Reports can be saved as custom views to be launched at any time
- All reports include both a chart and tabular data with options to show chart only or data only on any given view.
- Other graphical charting modifications available include Colors and Legend
Reporting
- Create Top N reports to see the top talkers, the most used applications or protocols.
- Top N Reports by bytes, packets, and other relative criteria, available for:
- Exporter
- Application
- Conversation
- Endpoint
- Protocol
- Sender
- Receiver
- Flexible time criteria available: absolute, specified and relative.
- Managed exporter details may be included in inventory reports including quantity and rate of flow data from device, and last date/time data was received.
- All reports can be executed immediately or on a schedule and the report output can be saved inPDF, HTML or CSV format.
Integrated Access Control
- Configurable functional permissions:
- Exporter registration
- Enable/Disable accepting data from exporter
- Traffic Flow Reporting
- Create/View/Update/Delete saved reports
- Multiprotocol Support: NetFlow v5, NetFlow v9, JFlow, IPFIX
Technical Specifications
Management Interface Support
Device Support Examples:
- NetFlow, JFlow and IPFIX
- Cisco
- Juniper
- Extreme
- Foundry
- 3Com
- Adtran
- Riverstone
- Enterasys
- Nortel
- Force 10
- Others
Operating Environments for Installation (Enterprise Editions)
- Microsoft Windows 2000, XP, 2003,Vista, 2008 Server
- Solaris
- Redhat ES Linux v4, 5
- SUSE Linux v9,10